
Most A/B tests fail to produce meaningful results, not because testing does not work, but because most teams test the wrong things, stop too early, or measure the wrong outcomes. A solid conversion rate optimization framework fixes that by giving you a repeatable process for finding real problems, forming testable hypotheses, and running experiments that actually influence revenue instead of vanity metrics. This guide walks through exactly how to build and run that process, step by step, so you can stop guessing and start optimizing with confidence.
Why Most A/B Tests Fail Before They Even Start
The biggest mistake in conversion rate optimization is treating testing as a creative exercise instead of a research-driven one. Teams often pick a page, change the button color or headline because it feels stale, and call it a test. Without data pointing to a real friction point, you are just guessing with extra steps.
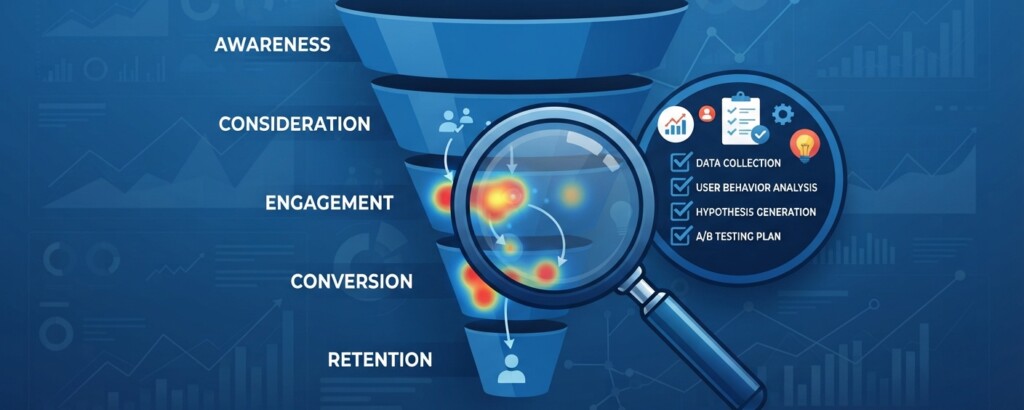
A proper CRO process starts with research, not ideas. You need to understand where users are dropping off, why they are dropping off, and what is stopping them from converting. This means combining quantitative data, like analytics funnels and heatmaps, with qualitative data, like session recordings, surveys, and user feedback. Only after you understand the problem should you start forming hypotheses.
Rule of thumb: if you cannot explain why a page is underperforming using data, you are not ready to test a solution for it yet.
Step 1: Build a Research-Backed Hypothesis
A hypothesis is not ‘let us try a red button instead of a blue one.’ A real hypothesis follows a specific structure that ties an observed problem to a proposed change and an expected outcome. The most reliable format looks like this: because we observed X (data), we believe changing Y will result in Z (measurable outcome), because of this reasoning.
For example: because 68 percent of mobile users abandon the checkout page at the shipping cost step (data from funnel analytics), we believe displaying estimated shipping costs earlier in the product page will reduce cart abandonment by at least 8 percent, because hidden costs are a top-cited reason for abandonment in customer surveys.
This structure forces you to justify the test before you build it, which naturally filters out low-value ideas and keeps your team focused on changes with real revenue potential.
- Identify the problem using analytics, heatmaps, and session recordings
- Validate the problem with qualitative data such as surveys or support tickets
- Write a hypothesis connecting the problem to a proposed solution and expected result
- Prioritize the hypothesis based on potential impact, confidence, and ease of implementation
- Design the test with a clear success metric tied to revenue or a revenue proxy
Step 2: Prioritize Tests That Actually Matter
Not every hypothesis deserves a test slot. Testing capacity is limited by traffic, time, and engineering resources, so prioritization matters as much as idea generation. A widely used method is the PIE framework, which scores each test idea on Potential, Importance, and Ease.
Potential asks how much room for improvement exists on that page or step. Importance asks how much traffic or revenue flows through that page. Ease asks how difficult the test is to build and launch. Score each factor from one to ten, average the three scores, and rank your backlog by the result. This keeps low-effort, high-impact tests at the top instead of letting the loudest voice in the room decide what gets tested next.
| Test Idea | Potential | Importance | Ease | Priority Score |
|---|---|---|---|---|
| Simplify checkout form fields | 8 | 9 | 6 | 7.7 |
| Add trust badges near CTA | 6 | 7 | 9 | 7.3 |
| Rewrite homepage headline | 5 | 8 | 7 | 6.7 |
| Change pricing page layout | 9 | 9 | 4 | 7.3 |
Notice that the checkout form and pricing page tests score similarly despite very different effort levels. This kind of side-by-side comparison is what keeps a testing roadmap grounded in data rather than internal opinion.
Step 3: Design Tests That Produce Clean, Trustworthy Data
A well-prioritized hypothesis can still produce useless results if the test itself is poorly designed. There are a few non-negotiable rules here. First, test one primary variable at a time unless you are intentionally running a multivariate test with enough traffic to support it. Second, define your primary success metric before launch, not after you see early results. Third, calculate your required sample size ahead of time so you know how long the test needs to run to reach statistical significance.
A common revenue-focused approach is to track both a leading metric, like click-through rate on a call to action, and a lagging metric, like completed purchases or sign-ups. Leading metrics tell you the change is working; lagging metrics confirm it is actually moving the number that matters.
Do not stop a test the moment it hits statistical significance if it has not yet reached your pre-calculated minimum sample size or run for at least one full business cycle, usually one to two weeks. Early significance is often a false positive caused by day-of-week traffic patterns or short-term novelty effects.
It also helps to segment your results by traffic source, device type, and new versus returning visitors. A variant that wins overall might actually be losing with your highest-value segment, mobile organic traffic for example, while winning with a lower-value segment like paid social. Segmenting protects you from optimizing for the wrong audience.
Step 4: Analyze Results Like a Skeptic, Not a Cheerleader
Once a test concludes, resist the urge to declare victory the moment the dashboard shows green. Ask three questions before rolling out a winning variant. Did the test reach the sample size and duration you planned for? Is the result consistent across your most important segments? And does the win translate into an actual revenue impact, not just a lift in an intermediate metric like clicks or sign-ups that never convert further down the funnel?
A test that increases email sign-ups by 15 percent sounds great until you discover those new subscribers convert to paying customers at half the rate of your existing list. Always trace a win as far down the funnel as your data allows, ideally all the way to revenue or customer lifetime value.
| Metric Type | Example | What It Tells You |
|---|---|---|
| Leading metric | Click-through rate on CTA | Whether the change is being noticed and acted on |
| Mid-funnel metric | Form completion rate | Whether users are progressing through the funnel |
| Lagging metric | Completed purchase or paid conversion | Whether the change actually drives revenue |
When in doubt, run a follow-up validation test on a winning variant before rolling it out to 100 percent of traffic. It costs a little time but saves you from scaling a false positive across your entire site.

Step 5: Build a Repeatable Conversion Rate Optimization Cadence
A single successful test is nice, but a conversion rate optimization program only compounds in value when it becomes a habit, not a one-off project. Set a regular cadence, weekly or biweekly, for reviewing your research inputs, updating your hypothesis backlog, and checking in on active tests. Document every test, win or loss, in a shared log that includes the hypothesis, the result, the segment breakdown, and what you learned. Losing tests are just as valuable as wins because they eliminate wrong assumptions and sharpen future hypotheses.
Over time, this log becomes an internal knowledge base that speeds up future hypothesis generation. If you already know that pricing transparency tests consistently underperform on your site but urgency messaging consistently overperforms, you can prioritize new tests accordingly instead of starting from scratch every quarter.
Key Takeaways
Running A/B tests that move revenue is less about clever design ideas and more about disciplined process. Start with research, not assumptions. Write hypotheses that connect data to a proposed change and an expected outcome. Prioritize your backlog using a simple scoring method like PIE so your team spends effort where it counts. Design tests with proper sample sizes and clear success metrics defined before launch. Analyze results with healthy skepticism, tracing every win down to actual revenue impact and checking for segment-level differences. Finally, treat conversion rate optimization as an ongoing cadence with a documented history, not a series of isolated experiments.
Want to go deeper on conversion optimization?
Explore more practical guides on analytics, testing frameworks, and marketing strategy to keep sharpening the skills that actually move your numbers.